
Main Street Health Report
October 2026
Labor and wage stats
Every month we measure how small businesses are actually doing, from the timesheets of more than 150,000 of them: who is working, how many hours, what they are paid, and how that compares with the same month in previous years.
Employees working was flat month over month, in line with a typical October, but is down 3.1% from a year ago. Because the comparison is year over year, the drop is not a seasonal effect.
- Hourly employees
- 2M+
- Small businesses
- 150K+
- Measured, not surveyed
- Timesheet data
Hourly employees
Small businesses
Measured, not surveyed

Main Street at a glance
The top things to know this month
+11.3%
The job market is warming for hourly workers. Turnover is up 11.3% year-over-year against hiring up 1.2% year-over-year. Wages were up 6.2% year-over-year, the fastest growth rate since January. This is good for hourly workers, but makes it harder for small businesses to retain workers.
-3.1%
Despite the rise in hiring and turnover, the number of employees working was down 3.1% year-over-year; the number of hours worked fell by 2.8% year-over-year. Small businesses are operating with a more labor-light model.
+3.0%
Hospitality led (+3.0% year-over-year employees working) while Food, Drink & Dining fell furthest (-4.8%). The Southeast was the softest region at -5.0%.



Employees Working
Employees Working Down 3.1% Year-Over-Year
Employees working was flat month over month, in line with a typical October, but is down 3.1% from a year ago. Because the comparison is year over year, the drop is not a seasonal effect.
(Monthly employees working, relative to a year earlier)
| Period | Employees Working |
|---|---|
| Oct'23 | +5.4% |
| Nov'23 | +5.1% |
| Dec'23 | +5.7% |
| Jan'24 | +2.2% |
| Feb'24 | +3.9% |
| Mar'24 | +3.4% |
| Apr'24 | +3.2% |
| May'24 | +2.6% |
| Jun'24 | +2.8% |
| Jul'24 | +1.7% |
| Aug'24 | +1.5% |
| Sep'24 | +1.7% |
| Oct'24 | +1.1% |
| Nov'24 | +5.3% |
| Dec'24 | -1.4% |
| Jan'25 | -0.6% |
| Feb'25 | -1.1% |
| Mar'25 | -0.5% |
| Apr'25 | -0.6% |
| May'25 | -1.9% |
| Jun'25 | -1.4% |
| Jul'25 | -0.4% |
| Aug'25 | -0.9% |
| Sep'25 | -1.1% |
| Oct'25 | -1.2% |
| Nov'25 | -1.4% |
| Dec'25 | -1.0% |
| Jan'26 | -1.7% |
| Feb'26 | -1.5% |
| Mar'26 | -1.7% |
| Apr'26 | -2.0% |
| May'26 | -2.1% |
| Jun'26 | -1.5% |
| Jul'26 | -1.6% |
| Aug'26 | -2.4% |
| Sep'26 | -2.5% |
| Oct'26 | -3.1% |
Data tallied over the 28 days ending on the 26th of the month, then compared to the same period a year earlier. Monthly changes compare only locations active in both months and are chained into an index.
Hours Worked
Hours Worked Down 2.8% Year-Over-Year
Hours worked was flat month over month, short of the +1.1% typical for October, and is down 2.8% year over year. Hours are falling slightly less than employees working, so hours per worker are edging up.
(Monthly hours worked, relative to a year earlier)
| Period | Hours Worked |
|---|---|
| Oct'23 | +5.8% |
| Nov'23 | +5.6% |
| Dec'23 | +6.3% |
| Jan'24 | +2.3% |
| Feb'24 | +4.5% |
| Mar'24 | +4.1% |
| Apr'24 | +3.8% |
| May'24 | +3.1% |
| Jun'24 | +3.3% |
| Jul'24 | +2.0% |
| Aug'24 | +1.9% |
| Sep'24 | +2.2% |
| Oct'24 | +1.6% |
| Nov'24 | +5.9% |
| Dec'24 | -0.6% |
| Jan'25 | +0.1% |
| Feb'25 | -0.7% |
| Mar'25 | +0.2% |
| Apr'25 | +0.1% |
| May'25 | -1.4% |
| Jun'25 | -0.9% |
| Jul'25 | +0.3% |
| Aug'25 | -0.3% |
| Sep'25 | -0.7% |
| Oct'25 | -0.8% |
| Nov'25 | -1.0% |
| Dec'25 | -0.9% |
| Jan'26 | -1.4% |
| Feb'26 | -1.0% |
| Mar'26 | -1.3% |
| Apr'26 | -1.6% |
| May'26 | -1.8% |
| Jun'26 | -1.1% |
| Jul'26 | -1.4% |
| Aug'26 | -2.1% |
| Sep'26 | -2.0% |
| Oct'26 | -2.8% |
Data tallied over the 28 days ending on the 26th of the month, then compared to the same period a year earlier. Monthly changes compare only locations active in both months and are chained into an index.
Businesses Open
Businesses Open Up 0.6% Year-Over-Year
The number of open businesses is growing, and is up 0.6% relative to a year ago. With employees working down 3.1%, the average open location has fewer workers on the clock.
(Monthly number of businesses open, relative to a year earlier)
| Period | Businesses Open |
|---|---|
| Oct'23 | +13.6% |
| Nov'23 | +13.3% |
| Dec'23 | +13.1% |
| Jan'24 | +12.0% |
| Feb'24 | +11.3% |
| Mar'24 | +10.9% |
| Apr'24 | +10.1% |
| May'24 | +9.5% |
| Jun'24 | +8.5% |
| Jul'24 | +7.3% |
| Aug'24 | +8.9% |
| Sep'24 | +7.0% |
| Oct'24 | +5.2% |
| Nov'24 | +3.7% |
| Dec'24 | +2.0% |
| Jan'25 | +0.9% |
| Feb'25 | +0.6% |
| Mar'25 | +0.6% |
| Apr'25 | +0.7% |
| May'25 | +0.2% |
| Jun'25 | -0.4% |
| Jul'25 | -0.4% |
| Aug'25 | -0.5% |
| Sep'25 | -0.9% |
| Oct'25 | -0.7% |
| Nov'25 | +0.6% |
| Dec'25 | +1.2% |
| Jan'26 | +0.7% |
| Feb'26 | +0.6% |
| Mar'26 | 0.0% |
| Apr'26 | -0.5% |
| May'26 | -0.3% |
| Jun'26 | -0.2% |
| Jul'26 | -0.1% |
| Aug'26 | +0.2% |
| Sep'26 | +0.4% |
| Oct'26 | +0.6% |
Count of businesses with at least one clock-in in the 28 days ending on the 26th of the month, compared to the same period a year earlier.
Employees Working, by region
Employees Working Varies Widely Across Regions
Employees working and hours worked fell year-over-year in every region, led by the Southeast (-5.0%) and Southwest (-4.2%). Only the Mid-Atlantic, Midwest and West added open businesses.
(Year-over-year change in “Businesses Open”, “Employees Working”, and “Hours Worked”, by region)
| Category | Businesses Open | Employees Working | Hours Worked |
|---|---|---|---|
| Mid-Atlantic | 1.7% | -2.3% | -1.4% |
| Midwest | 2.0% | -1.5% | -1.1% |
| Northeast | 0.0% | -3.1% | -2.5% |
| Southeast | -0.4% | -5.0% | -5.0% |
| Southwest | -0.3% | -4.2% | -4.0% |
| West | 0.2% | -2.4% | -2.3% |
Data tallied over the 28 days ending on the 26th of the month, then compared to the same period a year earlier. Monthly changes compare only locations active in both months and are chained into an index.
Employees Working, by metro
Employees Working Varies Widely Across Priority Markets
Los Angeles and New York experienced the smallest employment declines, and New York actually had an increase in the number of open businesses. Contractions were sharpest in Seattle and in major Sun Belt metros.
(Year-over-year change in “Businesses Open”, “Employees Working”, and “Hours Worked”, by market)
| Category | Businesses Open | Employees Working | Hours Worked |
|---|---|---|---|
| Atlanta | -4.8% | -8.9% | -8.6% |
| Chicago | -0.2% | -4.4% | -3.7% |
| Dallas | -0.4% | -5.0% | -4.5% |
| Houston | -4.3% | -5.2% | -5.4% |
| Los Angeles | -1.0% | -1.2% | -1.3% |
| Miami | -3.4% | -6.9% | -6.8% |
| New York | 1.0% | -2.3% | -1.6% |
| Seattle | -5.7% | -9.4% | -10.2% |
Data tallied over the 28 days ending on the 26th of the month, then compared to the same period a year earlier. Monthly changes compare only locations active in both months and are chained into an index.
Employees Working, by industry
Employees Working Varies Widely Across Industries
Hospitality grew fastest across open businesses, employees working (+3.0% year-over-year) and hours worked. Food, Drink & Dining fell furthest (-4.8%). Entertainment and medical/veterinary also added open businesses.
(Year-over-year change in “Businesses Open”, “Employees Working”, and “Hours Worked”, by industry)
| Category | Businesses Open | Employees Working | Hours Worked |
|---|---|---|---|
| Beauty & Wellness | -0.4% | -2.1% | -2.5% |
| Caregiving | -2.6% | -1.7% | -0.6% |
| Entertainment | 1.6% | -1.3% | -0.7% |
| Food, Drink, & Dining | 0.1% | -4.8% | -4.6% |
| Home & Repair | 0.4% | -2.7% | -1.6% |
| Hospitality | 8.5% | 3.0% | 4.1% |
| Medical / Veterinary | 1.7% | -0.3% | 0.0% |
| Retail | -0.6% | -2.8% | -2.8% |
Data tallied over the 28 days ending on the 26th of the month, then compared to the same period a year earlier. Monthly changes compare only locations active in both months and are chained into an index.
Hourly Wages
Wage Growth Has Stopped Falling
Year-over-year wage growth was 6.2%, the highest rate of 2026. As hiring and turnover accelerate, we may see wage growth heading upwards as well.
(Percent change in average “Hourly Wages”, Year over Year)
| Period | Wage Growth |
|---|---|
| Jan'23 | +11.3% |
| Feb'23 | +11.8% |
| Mar'23 | +12.3% |
| Apr'23 | +11.1% |
| May'23 | +11.2% |
| Jun'23 | +11.4% |
| Jul'23 | +11.6% |
| Aug'23 | +11.1% |
| Sep'23 | +11.7% |
| Oct'23 | +11.8% |
| Nov'23 | +12.8% |
| Dec'23 | +12.5% |
| Jan'24 | +12.1% |
| Feb'24 | +11.5% |
| Mar'24 | +11.0% |
| Apr'24 | +11.1% |
| May'24 | +10.6% |
| Jun'24 | +10.3% |
| Jul'24 | +9.7% |
| Aug'24 | +10.1% |
| Sep'24 | +9.2% |
| Oct'24 | +8.2% |
| Nov'24 | +7.9% |
| Dec'24 | +7.2% |
| Jan'25 | +7.0% |
| Feb'25 | +7.4% |
| Mar'25 | +7.7% |
| Apr'25 | +7.0% |
| May'25 | +6.6% |
| Jun'25 | +6.9% |
| Jul'25 | +7.1% |
| Aug'25 | +6.4% |
| Sep'25 | +6.8% |
| Oct'25 | +7.5% |
| Nov'25 | +7.0% |
| Dec'25 | +7.5% |
| Jan'26 | +6.4% |
| Feb'26 | +5.7% |
| Mar'26 | +5.6% |
| Apr'26 | +5.5% |
| May'26 | +5.8% |
| Jun'26 | +5.7% |
| Jul'26 | +5.7% |
| Aug'26 | +5.8% |
| Sep'26 | +6.2% |
| Oct'26 | +6.2% |
Data measures cumulative wage-rate change relative to January 2022.
Hourly Wages, by metro
Average Hourly Wages Continue to Climb
Pay has grown over the past year in major metro areas
(Average “Hourly Wages” across all jobs)
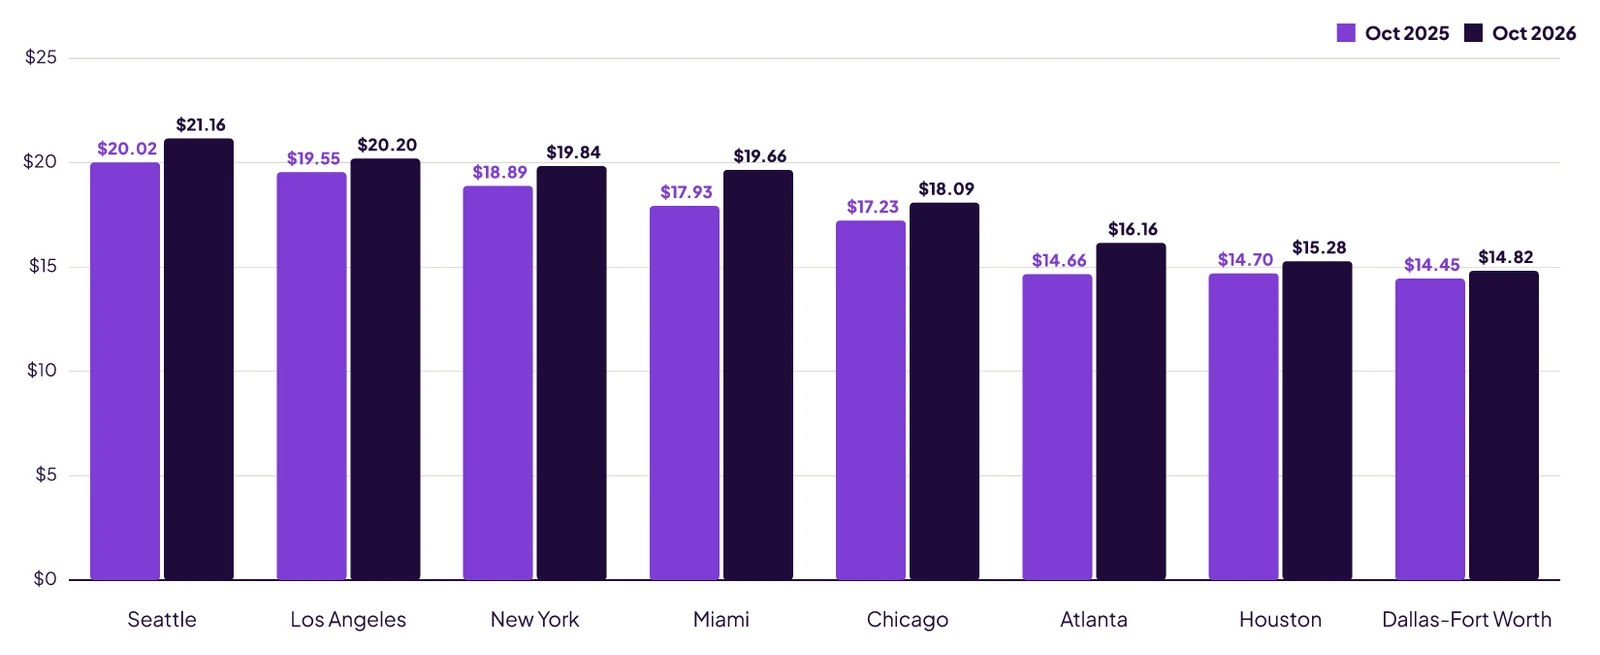
Data measures average hourly wages for locations that utilized Homebase Payroll in the reporting month and same month a year before.
Hourly Wages, by industry
Average Hourly Wages Continue to Climb
Pay has grown over the past year in every industry
(Average “Hourly Wages” across all jobs)
| Category | Oct 2025 | Oct 2026 |
|---|---|---|
| National Total | $15.88 | $16.86 |
| Food & Drink | $13.60 | $14.30 |
| Entertainment | $14.47 | $15.22 |
| Retail | $15.21 | $16.09 |
| Health Care | $20.10 | $20.94 |
| Professional Services | $17.86 | $18.50 |
Data measures average hourly wages for locations that utilized Homebase Payroll in the reporting month and same month a year before.
Jobs Added and Archived
Hiring and Turnover Rise as Labor Demand Grows
Hiring is +1.2% year-over-year and turnover is +11.3%, measured against the same month a year earlier. Workers are starting to regain some bargaining power.
(Year-over-year change in “Number of Jobs Added” and “Number of Jobs Archived” across all jobs)
| Period | Hiring | Turnover |
|---|---|---|
| Oct'23 | 1.6% | 9.3% |
| Nov'23 | 2.7% | -1.3% |
| Dec'23 | 3.3% | -9.1% |
| Jan'24 | -1.2% | -6.4% |
| Feb'24 | -0.2% | -5.0% |
| Mar'24 | 5.0% | -0.6% |
| Apr'24 | 4.8% | -3.3% |
| May'24 | 6.1% | 3.6% |
| Jun'24 | 7.1% | -12.0% |
| Jul'24 | 0.1% | -17.0% |
| Aug'24 | -1.2% | -16.5% |
| Sep'24 | -2.7% | -14.0% |
| Oct'24 | -6.2% | -17.5% |
| Nov'24 | 1.3% | -2.1% |
| Dec'24 | -8.5% | -6.3% |
| Jan'25 | -6.3% | -2.8% |
| Feb'25 | -5.3% | -0.9% |
| Mar'25 | -5.4% | -5.5% |
| Apr'25 | -5.9% | -6.5% |
| May'25 | -3.4% | -14.5% |
| Jun'25 | -5.0% | -3.4% |
| Jul'25 | -4.7% | 0.8% |
| Aug'25 | -2.7% | -1.5% |
| Sep'25 | -6.0% | -3.6% |
| Oct'25 | -2.7% | -4.4% |
| Nov'25 | -6.8% | -5.4% |
| Dec'25 | -2.4% | 0.1% |
| Jan'26 | -2.7% | -2.1% |
| Feb'26 | -2.3% | -8.0% |
| Mar'26 | -0.6% | -1.6% |
| Apr'26 | -1.7% | 1.0% |
| May'26 | -1.5% | -1.6% |
| Jun'26 | -2.7% | -1.9% |
| Jul'26 | -1.5% | -1.7% |
| Aug'26 | -2.3% | 9.6% |
| Sep'26 | 0.1% | 5.8% |
| Oct'26 | 1.2% | 11.3% |
Data measures average monthly change in official employee roster jobs added and archived.
Number of Jobs Added
Hiring Momentum Is Mixed
Jobs added fell 5.5% month over month, close to last October’s roughly 5% seasonal dip. Hiring is holding above year-ago levels (+1.2%). Despite talk of seasonal hiring, it usually peaks earlier in the year before dipping in the fall.
(Monthly change in average “Number of Jobs Added” across all jobs)
| Period | 2024 | 2025 | 2026 |
|---|---|---|---|
| Jan | 0.0% | 0.0% | 0.0% |
| Feb | 3.0% | 4.2% | 4.6% |
| Mar | 1.5% | 1.4% | 3.1% |
| Apr | 7.1% | 6.5% | 5.3% |
| May | 5.0% | 7.8% | 8.0% |
| Jun | -0.6% | -2.2% | -3.4% |
| Jul | -12.6% | -12.3% | -11.2% |
| Aug | 9.6% | 11.9% | 10.9% |
| Sep | -0.5% | -3.9% | -1.6% |
| Oct | -9.7% | -6.6% | -5.5% |
| Nov | 2.9% | -1.4% | no data |
| Dec | -11.9% | -7.6% | no data |
Data measures average monthly change in official employee roster jobs created.
Number of Jobs Archived
Turnover Declines As We Head Toward Year-End
Jobs archived dipped 1.3% month over month but remain 11.3% above a year ago. It tends to decline in the fall.
(Monthly change in average “Number of Jobs Archived” across all jobs)
| Period | 2024 | 2025 | 2026 |
|---|---|---|---|
| Jan | 0.0% | 0.0% | 0.0% |
| Feb | -2.5% | -0.5% | -6.6% |
| Mar | 0.1% | -4.6% | 2.1% |
| Apr | 2.9% | 1.8% | 4.5% |
| May | 15.0% | 5.2% | 2.4% |
| Jun | -12.0% | -0.5% | -0.8% |
| Jul | -5.9% | -1.8% | -1.6% |
| Aug | 11.6% | 9.1% | 21.5% |
| Sep | -1.0% | -3.1% | -6.4% |
| Oct | -5.4% | -6.2% | -1.3% |
| Nov | 0.1% | -1.0% | no data |
| Dec | -11.8% | -6.7% | no data |
Data measures average monthly change in official employee roster jobs archived.

How we measure Main Street
The dataset is based on Homebase data gathered from more than 150,000 businesses and 2 million hourly employees active in the US on our platform, one of the largest and most trusted sources of real-time data on employment growth across the small business landscape.
Beginning with this report, employees working, hours worked, and businesses open use chain-linked matched-cohort methodology: each month is a 28-day window ending on the 26th, compared only across locations active in both the current and prior window, and chained into a year-over-year series with no January reset. See the notes on each labor chart.
Wage, labor cost, hiring, and turnover data retain the existing cohort-based logic: daily figures are calculated relative to the median value for that specific day for the baseline month, net of the first 4 days of the month. A month is defined as the period from the 28th of the prior calendar month to the 27th of the current calendar month.
If you use any content from this report, please include a link to joinhomebase.com.
Measured from timesheets, not surveys
- Hourly employees
- 2M+
- Small businesses
- 150K+
Hourly employees
Small businesses
- Hours worked
Total hours recorded in Homebase timecards, chain-linked across locations active in both the current and prior 28-day window.
- Businesses open
Count of locations with at least one employee clock-in in the 28-day window.
- Employees working
Worker-days with at least one clock-in (not distinct workers), chain-linked across locations active in both windows.
- Hourly wages
Average hourly wages at businesses that ran Homebase Payroll in both October 2026 and October 2025.
The story behind the numbers
Read the monthly analysis
Every month the team writes up what these figures mean for the people running the businesses behind them: what changed, what it costs, and what to do about it.
Top-rated app built for small business teams.




We love talking data
Questions, or real-time access to Homebase data feeds?

Get the next report
A new report publishes every month. Leave an email and we will send the next one, or take this month with you now.
One email a month, the report and nothing else.
Run your team on the data behind Main Street
Scheduling, time clocks, payroll, hiring and team communication, free to get started.
Recognized by the people who cover small business.
Best Payroll for Hourly Teams
2024

Best in Business for Best AI Implementation
2025

Best Employee Scheduling
2025

Best HR & Employee App
2025